Graphical User Interface
To launch the interface, you must first install the anaconda tool. The following link directs you to the official anaconda
Installing WaterOptim Package
From Windows taskbar enter
anaconda, then click onAnaconda PromptEnter the instruction
pip install WaterOptimthenenter key
Update WaterOptim Package
From Windows taskbar enter
anaconda, then click onAnaconda PromptEnter the instruction
pip install WaterOptim --upgradethenenter key
Launching the user interface
From Windows taskbar enter
anaconda, then click onAnaconda PromptLaunch Python with the instruction
pythonthenenter keyImport
WaterOptimpackage with the instructionfrom WaterOptim.uiwpinch import pinchthenenter keyLaunch the interface with
pinch()instruction
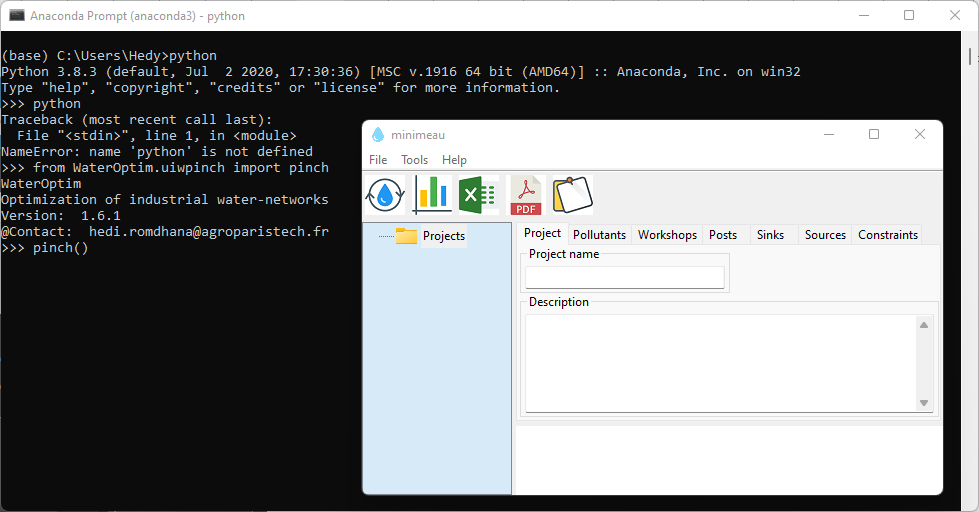
To benefit from all the features, this software should be activated with a license file (free of charge). To obtain the activation file, write to me at hedi.romdhana@agroparistech.fr

Examples
Dairy processing
Data Collection
We consider a hypothetical data representative of a dairy industry. The major challenge in terms of water-saving consists to reuse water from whey processing (microfiltration, reverse osmosis, and concentration). This water is considered a source (S1 and S2) that can potentially be reused in other processes.
We consider also the makeup water supplied in the cooling tower. This water is considered a sink (or demand D1) that can be supplied from the source streams.
Finally, we consider the use of water in CIPs for pre-washing (post 1) and rinsing (post 2) operations.
Inventory data is collected in the following table:
Workshop |
Inventory |
Type |
water m^3/h |
COD(in) ppm |
COD(out) ppm |
COD load kg/h |
|---|---|---|---|---|---|---|
Whey processing |
RO permeate |
|
10 |
– |
20 |
– |
Evaporation |
Condensates |
|
5 |
– |
60 |
– |
Cooling Tower |
Makeup Water |
|
5 |
20 |
– |
– |
CIPs |
Prewashing |
|
– |
20 |
1000 |
100 |
CIPs |
Rinsing |
|
– |
3 |
30 |
20 |

Whey Processing

Cooling Tower
New project
To add a new project, press Ctrl + N or click on New from File menu then enter the name of the project and add a description.
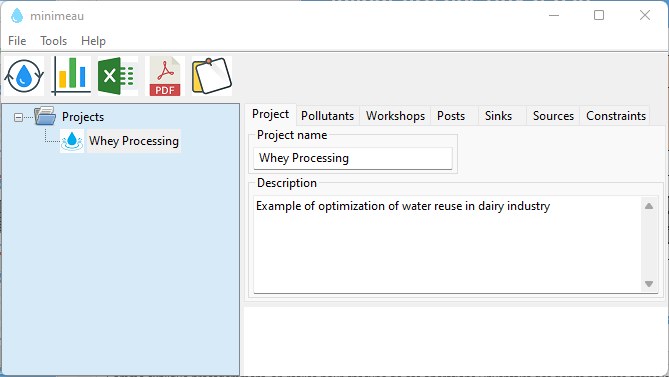
Add a new project
New pollutant
From the Pollutants tab, add the pollution indicator DCO (Chemical oxygen demand).
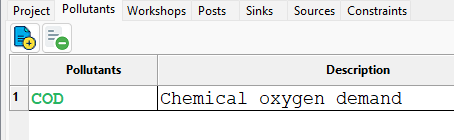
Add a new pollutant
Add inventories
Add the inventories of sources, sinks and posts, respectively from Sources, Sinks and Posts tabs. Water flowrate is expressed in m3/h, COD concentration in ppm, and COD mass load in kg/h.
Pinch analysis
Click on  to start the calculation. The result of the analysis is instantly displayed in a panel below the inventories.

Water Network